With wildfires raging across the West many of us are experiencing nasty air pollution, the most obvious being the gray-brown smoke that settles in every valley. But much of the issue with polluted air involves the invisible stuff, the tiny particulates that you don’t see and don’t notice you are breathing in.
The EPA measures these particulates when determining the Air Quality Index for an area. One of the standards involves particles that are less that 2.5 microns in diameter. A “micron” is another way to say “micro-meter” which means 10-6 of a meter (0.000001). So 2.5 micrometers (µm) is 0.0025 millimeters (mm) or about one ten-thousandth (0.0001) of an inch. That’s about the size of a bacterium.
The standard involves expressing a particle density as µg/m3, or micrograms per cubic meter. Something on the order of 35 µg/m3 is considered unhealthy for sensitive groups, 55 µg/m3 is considered generally unhealthy, and 150 µg/m3 is very unhealthy.
This is just the PM 2.5 standard. The AQI involves other inputs like carbon monoxide and such. But I want to look at just the fine particulates because of this outfit called PurpleAir.
PurpleAir makes sensors that anyone can purchase and begin monitoring their air quality. They also have a network where the data from the sensors can be accessed in real time. I discovered on their map page that my next door neighbors, the Siskiyou County Office of Education, has a sensor installed. In fact, they are installed at schools all over the County!
There’s a circle on the map with a number (PM 2.5 in µg/m3) and if you click on it you get a couple of pop-ups:
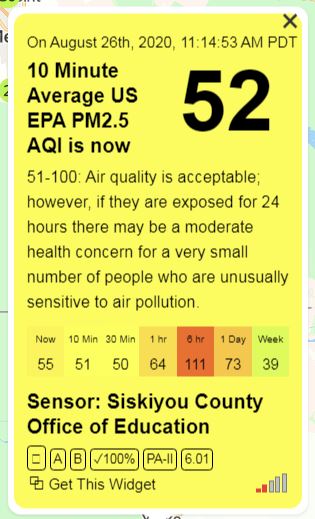

There’s a little + sign in the corner of the map that produces this pop-up:
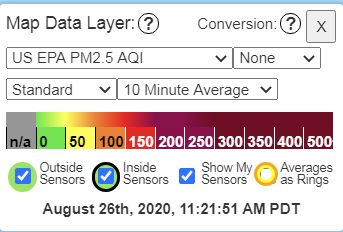
You can use the pull-downs to change what you see as there are twenty different variables measured such as humidity and temperature as well as different particulate standards.
You can see from the graph that the air here in Yreka has improved quite a bit since midnight last night.
There are a number of health issues associated with breathing particulates so it is good that we can keep track of this and use it to make decisions about our activities. Just because you can’t see or smell smoke doesn’t mean you are immune from its effects!
The EPA also has a site where you can enter your ZIP code and get the AQI and they also have a fire and smoke map.

This is really cool. I have bookmarked PurpleAir. What a great resource, especially now!
LikeLike
[…] of them: carbon monoxide, benzene, sulfur and nitrogen oxides, dioxins, formaldehyde, etc. Add in the particulates, especially the small ones (less than 2.5 microns), and weird stuff like mold spores, and you have […]
LikeLike